13-Week Rolling Cash Flow Forecast Model Excel Template (Weekly Treasury Liquidity & Revolver Tracker)
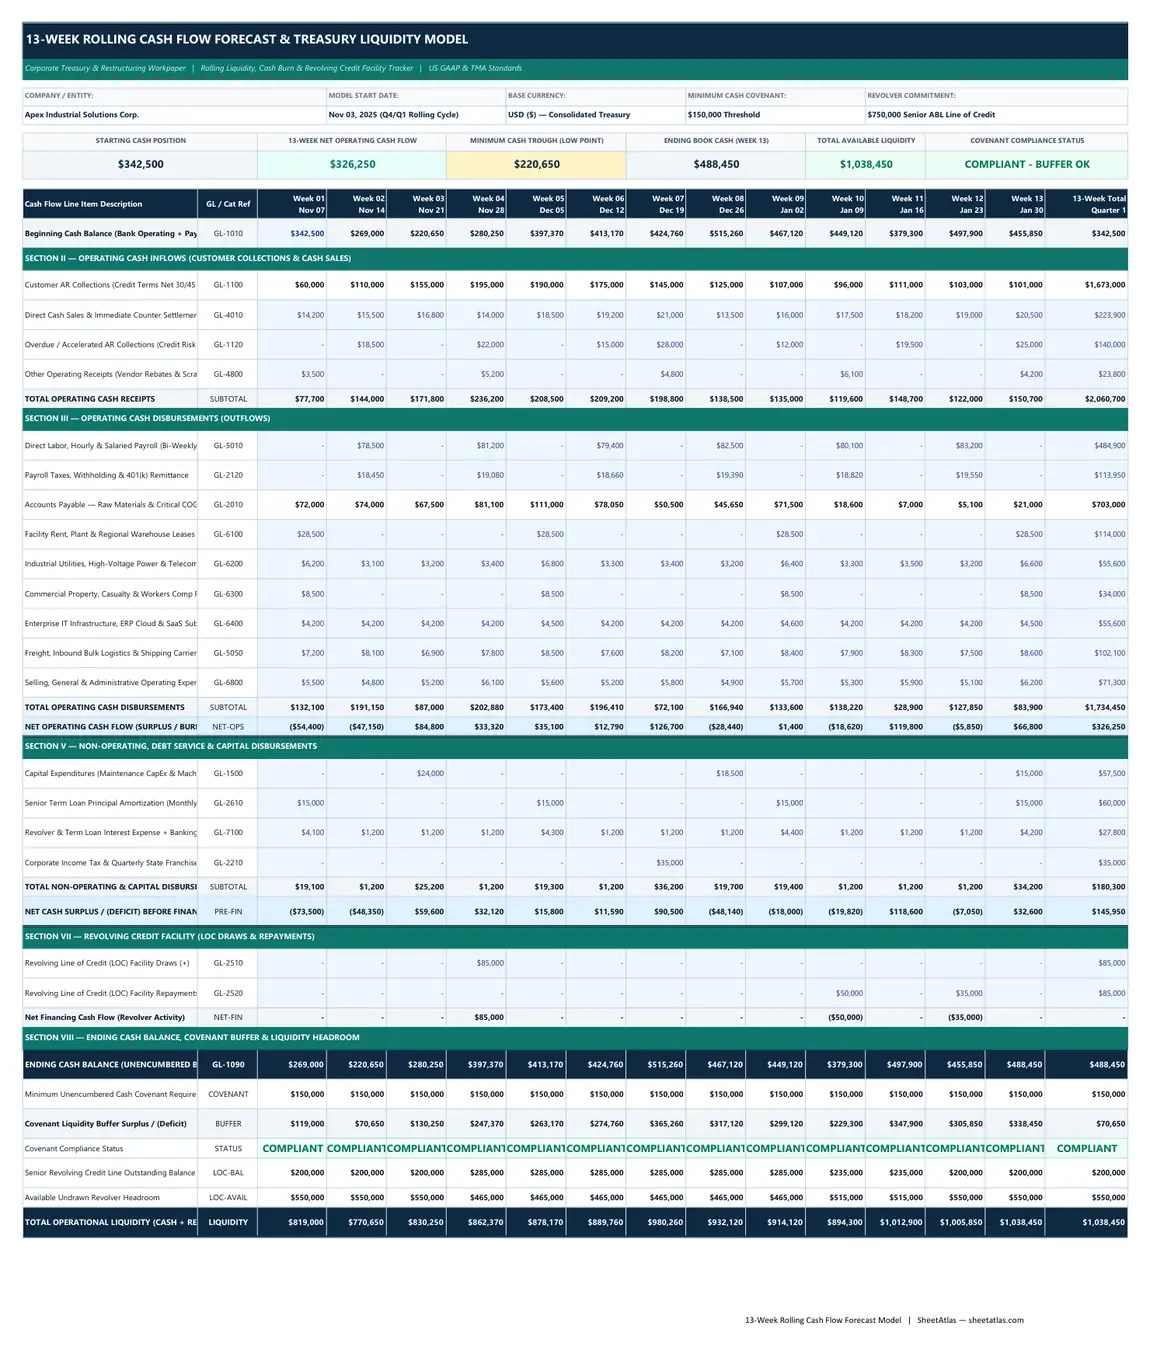
01_13Week_Cash_Forecast — Interactive Spreadsheet
| # | A | B | C | D | E | F | G | H | I | J | K | L | M | N | O | P |
|---|---|---|---|---|---|---|---|---|---|---|---|---|---|---|---|---|
| 1 | 13-WEEK ROLLING CASH FLOW FORECAST & TREASURY LIQUIDITY MODEL | |||||||||||||||
| 2 | Corporate Treasury & Restructuring Workpaper | Rolling Liquidity, Cash Burn & Revolving Credit Facility Tracker | US GAAP & TMA Standards | |||||||||||||||
| 3 | ||||||||||||||||
| 4 | COMPANY / ENTITY: | MODEL START DATE: | BASE CURRENCY: | MINIMUM CASH COVENANT: | REVOLVER COMMITMENT: | |||||||||||
| 5 | Apex Industrial Solutions Corp. | Nov 03, 2025 (Q4/Q1 Rolling Cycle) | USD ($) — Consolidated Treasury | $150,000 Threshold | $750,000 Senior ABL Line of Credit | |||||||||||
| 6 | ||||||||||||||||
| 7 | STARTING CASH POSITION | 13-WEEK NET OPERATING CASH FLOW | MINIMUM CASH TROUGH (LOW POINT) | ENDING BOOK CASH (WEEK 13) | TOTAL AVAILABLE LIQUIDITY | COVENANT COMPLIANCE STATUS | ||||||||||
| 8 | $342,500 | $326,250 | $220,650 | $488,450 | $1,038,450 | COMPLIANT - BUFFER OK | ||||||||||
| 9 | ||||||||||||||||
| 10 | Cash Flow Line Item Description | GL / Cat Ref | Week 01 Nov 07 | Week 02 Nov 14 | Week 03 Nov 21 | Week 04 Nov 28 | Week 05 Dec 05 | Week 06 Dec 12 | Week 07 Dec 19 | Week 08 Dec 26 | Week 09 Jan 02 | Week 10 Jan 09 | Week 11 Jan 16 | Week 12 Jan 23 | Week 13 Jan 30 | 13-Week Total Quarter 1 |
| 11 | Beginning Cash Balance (Bank Operating + Payroll Accounts) | GL-1010 | $269,000 | $220,650 | $280,250 | $397,370 | $413,170 | $424,760 | $515,260 | $467,120 | $449,120 | $379,300 | $497,900 | $455,850 | $342,500 | |
| 12 | SECTION II — OPERATING CASH INFLOWS (CUSTOMER COLLECTIONS & CASH SALES) | |||||||||||||||
| 13 | Customer AR Collections (Credit Terms Net 30/45 Schedule) | GL-1100 | $60,000 | $110,000 | $155,000 | $195,000 | $190,000 | $175,000 | $145,000 | $125,000 | $107,000 | $96,000 | $111,000 | $103,000 | $101,000 | $1,673,000 |
| 14 | Direct Cash Sales & Immediate Counter Settlements | GL-4010 | $223,900 | |||||||||||||
| 15 | Overdue / Accelerated AR Collections (Credit Risk Push) | GL-1120 | $140,000 | |||||||||||||
| 16 | Other Operating Receipts (Vendor Rebates & Scrap Sales) | GL-4800 | $23,800 | |||||||||||||
| 17 | TOTAL OPERATING CASH RECEIPTS | SUBTOTAL | $77,700 | $144,000 | $171,800 | $236,200 | $208,500 | $209,200 | $198,800 | $138,500 | $135,000 | $119,600 | $148,700 | $122,000 | $150,700 | $2,060,700 |
| 18 | SECTION III — OPERATING CASH DISBURSEMENTS (OUTFLOWS) | |||||||||||||||
| 19 | Direct Labor, Hourly & Salaried Payroll (Bi-Weekly Cycle) | GL-5010 | $484,900 | |||||||||||||
| 20 | Payroll Taxes, Withholding & 401(k) Remittance | GL-2120 | $113,950 | |||||||||||||
| 21 | Accounts Payable — Raw Materials & Critical COGS Vendors | GL-2010 | $72,000 | $74,000 | $67,500 | $81,100 | $111,000 | $78,050 | $50,500 | $45,650 | $71,500 | $18,600 | $7,000 | $5,100 | $21,000 | $703,000 |
| 22 | Facility Rent, Plant & Regional Warehouse Leases (Monthly) | GL-6100 | $114,000 | |||||||||||||
| 23 | Industrial Utilities, High-Voltage Power & Telecom | GL-6200 | $55,600 | |||||||||||||
| 24 | Commercial Property, Casualty & Workers Comp Premiums | GL-6300 | $34,000 | |||||||||||||
| 25 | Enterprise IT Infrastructure, ERP Cloud & SaaS Subscriptions | GL-6400 | $55,600 | |||||||||||||
| 26 | Freight, Inbound Bulk Logistics & Shipping Carriers | GL-5050 | $102,100 | |||||||||||||
| 27 | Selling, General & Administrative Operating Expenses | GL-6800 | $71,300 | |||||||||||||
| 28 | TOTAL OPERATING CASH DISBURSEMENTS | SUBTOTAL | $132,100 | $191,150 | $87,000 | $202,880 | $173,400 | $196,410 | $72,100 | $166,940 | $133,600 | $138,220 | $28,900 | $127,850 | $83,900 | $1,734,450 |
| 29 | NET OPERATING CASH FLOW (SURPLUS / BURN) | NET-OPS | -$54,400 | -$47,150 | $84,800 | $33,320 | $35,100 | $12,790 | $126,700 | -$28,440 | $1,400 | -$18,620 | $119,800 | -$5,850 | $66,800 | $326,250 |
| 30 | SECTION V — NON-OPERATING, DEBT SERVICE & CAPITAL DISBURSEMENTS | |||||||||||||||
| 31 | Capital Expenditures (Maintenance CapEx & Machine Tooling) | GL-1500 | $57,500 | |||||||||||||
| 32 | Senior Term Loan Principal Amortization (Monthly Schedule) | GL-2610 | $60,000 | |||||||||||||
| 33 | Revolver & Term Loan Interest Expense + Banking Fees | GL-7100 | $27,800 | |||||||||||||
| 34 | Corporate Income Tax & Quarterly State Franchise Taxes | GL-2210 | $35,000 | |||||||||||||
| 35 | TOTAL NON-OPERATING & CAPITAL DISBURSEMENTS | SUBTOTAL | $19,100 | $1,200 | $25,200 | $1,200 | $19,300 | $1,200 | $36,200 | $19,700 | $19,400 | $1,200 | $1,200 | $1,200 | $34,200 | $180,300 |
| 36 | NET CASH SURPLUS / (DEFICIT) BEFORE FINANCING | PRE-FIN | -$73,500 | -$48,350 | $59,600 | $32,120 | $15,800 | $11,590 | $90,500 | -$48,140 | -$18,000 | -$19,820 | $118,600 | -$7,050 | $32,600 | $145,950 |
| 37 | SECTION VII — REVOLVING CREDIT FACILITY (LOC DRAWS & REPAYMENTS) | |||||||||||||||
| 38 | Revolving Line of Credit (LOC) Facility Draws (+) | GL-2510 | $85,000 | |||||||||||||
| 39 | Revolving Line of Credit (LOC) Facility Repayments (-) | GL-2520 | $85,000 | |||||||||||||
| 40 | Net Financing Cash Flow (Revolver Activity) | NET-FIN | $0 | $0 | $0 | $85,000 | $0 | $0 | $0 | $0 | $0 | -$50,000 | $0 | -$35,000 | $0 | $0 |
| 41 | SECTION VIII — ENDING CASH BALANCE, COVENANT BUFFER & LIQUIDITY HEADROOM | |||||||||||||||
| 42 | ENDING CASH BALANCE (UNENCUMBERED BOOK CASH) | GL-1090 | $269,000 | $220,650 | $280,250 | $397,370 | $413,170 | $424,760 | $515,260 | $467,120 | $449,120 | $379,300 | $497,900 | $455,850 | $488,450 | $488,450 |
| 43 | Minimum Unencumbered Cash Covenant Requirement | COVENANT | $150,000 | $150,000 | $150,000 | $150,000 | $150,000 | $150,000 | $150,000 | $150,000 | $150,000 | $150,000 | $150,000 | $150,000 | $150,000 | $150,000 |
| 44 | Covenant Liquidity Buffer Surplus / (Deficit) | BUFFER | $119,000 | $70,650 | $130,250 | $247,370 | $263,170 | $274,760 | $365,260 | $317,120 | $299,120 | $229,300 | $347,900 | $305,850 | $338,450 | $70,650 |
| 45 | Covenant Compliance Status | STATUS | COMPLIANT | COMPLIANT | COMPLIANT | COMPLIANT | COMPLIANT | COMPLIANT | COMPLIANT | COMPLIANT | COMPLIANT | COMPLIANT | COMPLIANT | COMPLIANT | COMPLIANT | COMPLIANT |
| 46 | Senior Revolving Credit Line Outstanding Balance | LOC-BAL | $200,000 | $200,000 | $200,000 | $285,000 | $285,000 | $285,000 | $285,000 | $285,000 | $285,000 | $235,000 | $235,000 | $200,000 | $200,000 | $200,000 |
| 47 | Available Undrawn Revolver Headroom | LOC-AVAIL | $550,000 | $550,000 | $550,000 | $465,000 | $465,000 | $465,000 | $465,000 | $465,000 | $465,000 | $515,000 | $515,000 | $550,000 | $550,000 | $550,000 |
| 48 | TOTAL OPERATIONAL LIQUIDITY (CASH + REVOLVER) | LIQUIDITY | $819,000 | $770,650 | $830,250 | $862,370 | $878,170 | $889,760 | $980,260 | $932,120 | $914,120 | $894,300 | $1,012,900 | $1,005,850 | $1,038,450 | $1,038,450 |
Free Instant Download
No email signup • Unlocked formulas
Built-In Excel Formulas & Calculation Logic
Unlocked native Microsoft Excel functions pre-programmed inside this workbook:
=C42 Links each subsequent week's opening cash position (e.g., Cell D11 for Week 2) directly to the prior week's ending cash balance after financing (Cell C42), guaranteeing zero disconnect across the 13-week timeline.
=C17-C28 Calculates net operational cash flow by subtracting total weekly operating disbursements (direct labor, payroll taxes, vendor accounts payable, rent, utilities, and freight) from gross customer collections and operating receipts.
=MIN(C42:O42) Scans across all 13 weekly projected ending cash balances to instantly surface the business's 'trough week'—the exact calendar period where cash reaches its lowest projected point—allowing management to proactively arrange credit draws.
=MIN(D7, D16+D19) Evaluates the lesser of the lender's committed credit facility limit (Cell D7) and the collateral-backed borrowing base formula (85% of eligible accounts receivable + 50% of eligible inventory) to determine actual legal borrowing availability.
=IF(MIN(C44:O44)>=0, "COMPLIANT - BUFFER OK", "ALERT - DEFICIT") Compares every week's projected ending cash against the bank's mandatory minimum unencumbered liquidity covenant ($150,000) and displays an immediate compliance certification or breach alert.
Full Workbook Print Layout Preview (.XLSX)
Overview & Industry Standard Alignment
In corporate finance and treasury operations, the 13-Week Cash Flow Forecast Model (often abbreviated as the TWCF or 13-week model) is the universal operational gold standard for managing enterprise liquidity, cash burn, working capital squeezes, and turnaround restructuring. Unlike indirect cash flow projections that adjust accrual net income for non-cash depreciation and working capital changes over annual horizons, the 13-week model operates strictly on the Direct Cash Method—tracking the exact calendar timing of physical cash inflows (cleared customer receipts) and cash outflows (disbursed checks, ACH wires, and payroll runs). A 13-week horizon equals exactly one calendar quarter (91 days), providing the optimal tactical balance: it is long enough to identify mid-term cash pinches, covenant breaches, and seasonal demand spikes before they materialize, yet granular enough to be managed at the individual customer invoice, vendor voucher, and payroll batch level. Corporate treasurers, private equity operating partners, and commercial loan officers require this model because standard ERP cash flow reports cannot incorporate dynamic collection probabilities or tactical payment hold decisions. This workbook is engineered to institutional standards. Sheet 1 delivers the executive 13-week forecast grid with real-time KPI cards for starting cash, net operating burn, trough week liquidity, ending cash, and covenant compliance. Sheet 2 provides granular supporting subledgers for 13 major commercial customer accounts receivable collections and 13 critical supplier accounts payable disbursements. Sheet 3 houses the complete Revolving Credit Facility (LOC) borrowing base calculator, interest rate parameters, liquidity covenants, and a step-by-step CFO maintenance guide.
Practical Operational Use Cases:
Corporate Restructuring & Turnaround Management (TMA Standard)
Establish weekly cash rationing and liquidity visibility during distressed turnarounds, Chapter 11 debtor-in-possession (DIP) financing, or operational reorganizations.
Asset-Based Lending (ABL) Borrowing Base & Revolver Management
Calculate weekly eligible collateral (85% AR + 50% Inventory), determine available revolver headroom, and schedule draws/repayments with 48-hour lender notice.
High-Growth Working Capital Squeeze Management
Prevent insolvency during rapid sales expansions where customer receivables and inventory buildup consume cash faster than profits generate it.
Private Equity Portfolio Company Treasury Oversight
Deliver standardized 13-week cash visibility, debt service coverage, and CapEx timing reports to board members and sponsor investment committees.
Designed For:
What’s Inside the Workbook (Tab-by-Tab Breakdown)
01_13Week_Cash_Forecast (Executive Treasury Lead Schedule)
Consolidated 13-week master forecast featuring executive metadata, 6 live KPI summary cards (Starting Cash, 13-Week Net Operating Cash, Minimum Cash Trough, Ending Cash, Total Liquidity, and Covenant Status), and an 8-section direct cash model with 100% dynamic formulas across 16 columns.
02_AR_AP_Weekly_Schedule (Supporting Accounts Receivable & Accounts Payable Subledgers)
Granular operational subledgers detailing weekly collection forecasts across 13 major commercial customer accounts (Table 1) and scheduled payment release amounts across 13 critical supplier accounts payable vouchers (Table 2), which flow directly into the master forecast.
03_Revolver_and_Assumptions (Credit Facility Terms, Borrowing Base & CFO Guide)
Comprehensive parameter tab containing the senior revolving credit facility agreement terms (SOFR base rate, margin spread, commitment fee), asset-based borrowing base calculation (AR and Inventory advance rates), liquidity covenants ($150,000 minimum cash), and a 5-step CFO operational maintenance guide.
Practitioner Tips & Best Practices
-
✓
Always Model Disbursements by Execution Date Rather Than Invoice Due Date: Do not simply schedule vendor payments on their nominal Net 30 due dates. Work with Procurement to identify mandatory must-pay suppliers (raw materials, utilities, payroll) versus flexible vendors where payment can be held to protect the trough week cash buffer.
-
✓
Identify and Protect the 'Trough Week' at Least 4 Weeks in Advance: The trough week is the single lowest cash point across the 13-week horizon—often created by the convergence of bi-weekly payroll, quarterly tax remittances, and major vendor runs. By identifying it 30 days early, management has ample time to accelerate receivables or request a revolver draw.
-
✓
Maintain a Strict Monday-Morning Bank Statement Tie-Out Discipline: A 13-week forecast is only as reliable as its starting cash. Every Monday morning before 09:00 AM, reconcile Cell C11 against confirmed cleared bank balances across all operating and payroll accounts, subtracting stale uncashed checks.
-
✓
Establish an Asset-Based Borrowing Base Certificate Reconciliation: If your company utilizes a revolving line of credit, ensure your eligible accounts receivable figure in Tab 03 strictly deducts cross-aged balances (accounts where >50% is over 90 days), foreign receivables, and affiliate receivables per your credit agreement.
Frequently Asked Questions
Why is a 13-week horizon considered the gold standard for cash flow forecasting?
A 13-week period represents exactly one quarter (91 days or 13 seven-day weeks). In corporate finance and turnaround management, this window provides the ideal balance: it is long enough to anticipate seasonal slowdowns, quarterly tax obligations, and supplier debt maturities, yet short enough that customer receivables and vendor disbursements can be forecasted with high tactical accuracy.
What is the difference between the Direct Method and Indirect Method of cash forecasting?
The Indirect Method begins with net income from the accrual income statement and adjusts for non-cash expenses (depreciation, amortization) and net changes in balance sheet working capital. The Direct Method—used in this 13-week template—tracks actual physical cash moving in and out of company bank accounts (cleared customer checks, ACH payroll disbursements, wire transfers to vendors), making it vastly superior for day-to-day liquidity management.
How does this 13-week cash flow model handle revolving lines of credit (LOC)?
The model features a dedicated Revolving Credit Facility section (Section VII on Tab 01) linked to credit parameters on Tab 03. When operating burn tightens cash, users can input LOC draws, which increase ending book cash while increasing outstanding revolver debt and reducing undrawn headroom. As cash flow turns positive, repayments can be scheduled, with interest calculated based on benchmark SOFR plus margin spread.
How do I roll the 13-week forecast forward each week?
At the close of each business week (typically Friday afternoon or Monday morning), freeze the completed week's numbers into an 'Actuals' archive tab. On Tab 01, replace Week 1 with the new cleared bank balance, shift all future weeks left by one column, and populate Week 13 with the newly projected 13th week horizon to maintain continuous 13-week forward visibility.
What is a 'Trough Week' and why do lenders scrutinize it?
The trough week is the week within the 13-week forecast where the business's projected unencumbered cash balance reaches its absolute lowest point. Commercial lenders and private equity sponsors scrutinize the trough week because it represents the highest probability of an overdraft or covenant breach, dictating the maximum credit line size required to ensure solvency.
Can I adapt this model for multi-currency or international treasury operations?
Yes. While the default currency formatting is in US Dollars ($), all cells and formulas are 100% unlocked. You can select all sheets and update the Excel number format to Euros (€), British Pounds (£), Canadian Dollars (C$), or Japanese Yen (¥) without breaking any formula dependencies.