Restaurant Recipe Costing & Menu Engineering Excel Template (AP/EP Yield %, Plate Cost & Food Cost %)
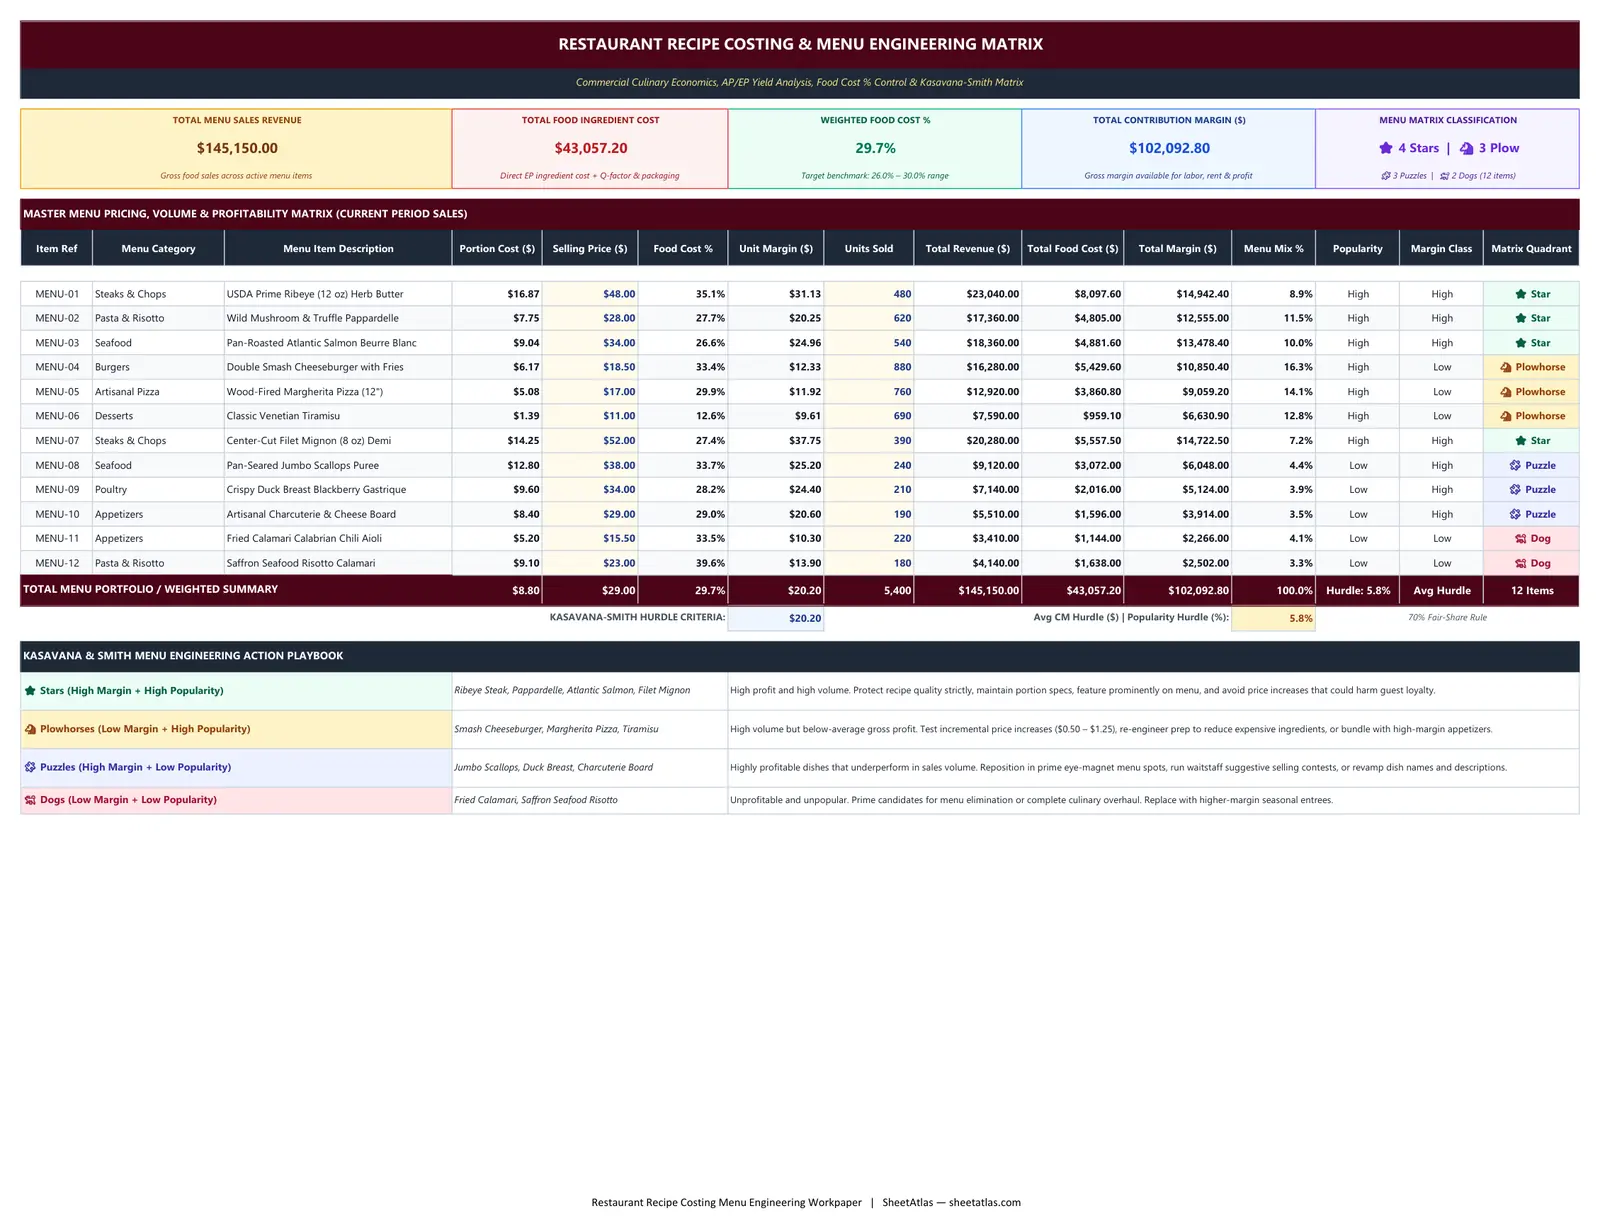
01_Menu_Engineering_Matrix — Interactive Spreadsheet
| # | A | B | C | D | E | F | G | H | I | J | K | L | M | N | O |
|---|---|---|---|---|---|---|---|---|---|---|---|---|---|---|---|
| 1 | RESTAURANT RECIPE COSTING & MENU ENGINEERING MATRIX | ||||||||||||||
| 2 | Commercial Culinary Economics, AP/EP Yield Analysis, Food Cost % Control & Kasavana-Smith Matrix | ||||||||||||||
| 3 | |||||||||||||||
| 4 | TOTAL MENU SALES REVENUE | TOTAL FOOD INGREDIENT COST | WEIGHTED FOOD COST % | TOTAL CONTRIBUTION MARGIN ($) | MENU MATRIX CLASSIFICATION | ||||||||||
| 5 | $145,150.00 | $43,057.20 | 29.7% | $102,092.80 | ⭐ 4 Stars | 🐴 3 Plow | ||||||||||
| 6 | Gross food sales across active menu items | Direct EP ingredient cost + Q-factor & packaging | Target benchmark: 26.0% – 30.0% range | Gross margin available for labor, rent & profit | 🧩 3 Puzzles | 🐕 2 Dogs (12 items) | ||||||||||
| 7 | |||||||||||||||
| 8 | MASTER MENU PRICING, VOLUME & PROFITABILITY MATRIX (CURRENT PERIOD SALES) | ||||||||||||||
| 9 | Item Ref | Menu Category | Menu Item Description | Portion Cost ($) | Selling Price ($) | Food Cost % | Unit Margin ($) | Units Sold | Total Revenue ($) | Total Food Cost ($) | Total Margin ($) | Menu Mix % | Popularity | Margin Class | Matrix Quadrant |
| 10 | |||||||||||||||
| 11 | MENU-01 | Steaks & Chops | USDA Prime Ribeye (12 oz) Herb Butter | $16.87 | 35.1% | $31.13 | $23,040.00 | $8,097.60 | $14,942.40 | 8.9% | High | High | ⭐ Star | ||
| 12 | MENU-02 | Pasta & Risotto | Wild Mushroom & Truffle Pappardelle | $7.75 | 27.7% | $20.25 | $17,360.00 | $4,805.00 | $12,555.00 | 11.5% | High | High | ⭐ Star | ||
| 13 | MENU-03 | Seafood | Pan-Roasted Atlantic Salmon Beurre Blanc | $9.04 | 26.6% | $24.96 | $18,360.00 | $4,881.60 | $13,478.40 | 10.0% | High | High | ⭐ Star | ||
| 14 | MENU-04 | Burgers | Double Smash Cheeseburger with Fries | $6.17 | 33.4% | $12.33 | $16,280.00 | $5,429.60 | $10,850.40 | 16.3% | High | Low | 🐴 Plowhorse | ||
| 15 | MENU-05 | Artisanal Pizza | Wood-Fired Margherita Pizza (12") | $5.08 | 29.9% | $11.92 | $12,920.00 | $3,860.80 | $9,059.20 | 14.1% | High | Low | 🐴 Plowhorse | ||
| 16 | MENU-06 | Desserts | Classic Venetian Tiramisu | $1.39 | 12.6% | $9.61 | $7,590.00 | $959.10 | $6,630.90 | 12.8% | High | Low | 🐴 Plowhorse | ||
| 17 | MENU-07 | Steaks & Chops | Center-Cut Filet Mignon (8 oz) Demi | $14.25 | 27.4% | $37.75 | $20,280.00 | $5,557.50 | $14,722.50 | 7.2% | High | High | ⭐ Star | ||
| 18 | MENU-08 | Seafood | Pan-Seared Jumbo Scallops Puree | $12.80 | 33.7% | $25.20 | $9,120.00 | $3,072.00 | $6,048.00 | 4.4% | Low | High | 🧩 Puzzle | ||
| 19 | MENU-09 | Poultry | Crispy Duck Breast Blackberry Gastrique | $9.60 | 28.2% | $24.40 | $7,140.00 | $2,016.00 | $5,124.00 | 3.9% | Low | High | 🧩 Puzzle | ||
| 20 | MENU-10 | Appetizers | Artisanal Charcuterie & Cheese Board | $8.40 | 29.0% | $20.60 | $5,510.00 | $1,596.00 | $3,914.00 | 3.5% | Low | High | 🧩 Puzzle | ||
| 21 | MENU-11 | Appetizers | Fried Calamari Calabrian Chili Aioli | $5.20 | 33.5% | $10.30 | $3,410.00 | $1,144.00 | $2,266.00 | 4.1% | Low | Low | 🐕 Dog | ||
| 22 | MENU-12 | Pasta & Risotto | Saffron Seafood Risotto Calamari | $9.10 | 39.6% | $13.90 | $4,140.00 | $1,638.00 | $2,502.00 | 3.3% | Low | Low | 🐕 Dog | ||
| 23 | TOTAL MENU PORTFOLIO / WEIGHTED SUMMARY | $8.80 | $29.00 | 29.7% | $20.20 | 5,400 | $145,150.00 | $43,057.20 | $102,092.80 | 100.0% | Hurdle: 5.8% | Avg Hurdle | 12 Items | ||
| 24 | KASAVANA-SMITH HURDLE CRITERIA: | $20.20 | Avg CM Hurdle ($) | Popularity Hurdle (%): | 5.8% | 70% Fair-Share Rule | ||||||||||
| 25 | |||||||||||||||
| 26 | KASAVANA & SMITH MENU ENGINEERING ACTION PLAYBOOK | ||||||||||||||
| 27 | ⭐ Stars (High Margin + High Popularity) | Ribeye Steak, Pappardelle, Atlantic Salmon, Filet Mignon | High profit and high volume. Protect recipe quality strictly, maintain portion specs, feature prominently on menu, and avoid price increases that could harm guest loyalty. | ||||||||||||
| 28 | 🐴 Plowhorses (Low Margin + High Popularity) | Smash Cheeseburger, Margherita Pizza, Tiramisu | High volume but below-average gross profit. Test incremental price increases ($0.50 – $1.25), re-engineer prep to reduce expensive ingredients, or bundle with high-margin appetizers. | ||||||||||||
| 29 | 🧩 Puzzles (High Margin + Low Popularity) | Jumbo Scallops, Duck Breast, Charcuterie Board | Highly profitable dishes that underperform in sales volume. Reposition in prime eye-magnet menu spots, run waitstaff suggestive selling contests, or revamp dish names and descriptions. | ||||||||||||
| 30 | 🐕 Dogs (Low Margin + Low Popularity) | Fried Calamari, Saffron Seafood Risotto | Unprofitable and unpopular. Prime candidates for menu elimination or complete culinary overhaul. Replace with higher-margin seasonal entrees. | ||||||||||||
Free Instant Download
No email signup • Unlocked formulas
Built-In Excel Formulas & Calculation Logic
Unlocked native Microsoft Excel functions pre-programmed inside this workbook:
=ROUND(AP_Cost / Yield_Percent, 4) Calculates the true culinary cost per usable ounce or pound by adjusting broadline distributor purchase cost for trim loss, bone weight, peeling waste, and thermal cooking shrinkage.
=ROUND((Raw_Subtotal * (1 + Q_Factor) + Packaging) / Batch_Portions, 2) Incorporates unmeasured micro-ingredients (cooking oil, butter, seasonings, pan spray) via a 2.5%–4.0% Q-factor markup plus takeout packaging allowances divided by standardized portion yield.
=ROUND(Portion_Plate_Cost / Target_Food_Cost_Pct, 2) Determines the target menu selling price required to hit hospitality profit benchmarks (e.g., 28% for entrees, 18% for pasta/pizza) before applying psychological retail price ending adjustments.
=IFERROR(Portion_Plate_Cost / Menu_Selling_Price, 0) Calculates the real-world food cost percentage of an active menu item, providing early warning when distributor ingredient inflation erodes target gross margins.
=IF(AND(Popularity="High", Margin="High"), "⭐ Star", IF(AND(Popularity="High", Margin="Low"), "🐴 Plowhorse", IF(AND(Popularity="Low", Margin="High"), "🧩 Puzzle", "🐕 Dog"))) Automatically segments menu items into four operational quadrants by benchmarking each item's sales volume against the 70% fair-share hurdle rate and its unit contribution margin against the menu average.
Full Workbook Print Layout Preview (.XLSX)
Overview & Industry Standard Alignment
Commercial restaurant profitability is won or lost in the fractions of a cent on recipe cards. In full-service restaurants, fast-casual kitchens, and commercial bakeries, the single most common cause of financial distress is costing menu items using gross As-Purchased (AP) distributor invoice prices rather than true Edible Portion (EP) yields. When an executive chef purchases a whole beef tenderloin or a side of fresh salmon, between 10% and 25% of that raw weight is trimmed away as fat, silver skin, or bone before cooking. If those trimming losses are ignored, a dish that appears to operate at a healthy 28% food cost may actually be running at an unsustainable 36% food cost, quietly evaporating thousands of dollars in monthly net profit. This Restaurant Recipe Costing & Menu Engineering Excel Template provides an institutional-grade financial framework that bridges the gap between kitchen prep tables and executive P&L statements. It combines precision culinary conversions (AP weight to EP yield, batch batching, standardized portion sizes, and unmeasured micro-ingredient Q-factors) with broadline purchasing database integration. By establishing a centralized 40-item ingredient library linked directly to standardized recipe cards, any change in distributor case pricing automatically updates the cost of every affected dish across your entire menu in real time. Beyond basic plate costing, the template incorporates the renowned Kasavana & Smith Menu Engineering Matrix. By analyzing unit sales counts alongside dollar contribution margins, the model automatically categorizes every item into Stars, Plowhorses, Puzzles, and Dogs. Rather than blindly raising prices or slashing portion sizes across the board, restaurant operators can deploy surgical, data-driven menu tactics: protecting Stars, recalibrating Plowhorse ingredient portions, promoting high-margin Puzzles through staff incentive contests, and eliminating unprofitable Dogs from upcoming seasonal menus.
Practical Operational Use Cases:
Full-Service Independent Restaurants & Bistros
Establish standardized recipe cost cards for appetizers, signature steaks, seafood, and house pastas with real-time AP/EP butcher yield factors and automated plate costing.
Fast Casual Chains & Multi-Unit Concepts
Standardize portion costs, packaging allowances, and target food cost percentages across multiple kitchen locations to safeguard franchise unit economics and prime costs.
Commercial Bakeries & Pastry Operations
Accurately cost high-volume dough batches, layered cakes, and viennoiserie, accounting for batch pan scaling, parchment liners, and precise egg/butter gram weights.
Hotel Food & Beverage (F&B) & Banquet Catering
Engineer banquet event orders (BEO), calculate bulk preparation yields, and simulate buffet versus plated service margins to guarantee banquet contract profitability.
Craft Breweries, Gastropubs & Cocktail Lounges
Model kitchen bar snacks, high-volume smash burgers, and craft cocktail syrup/citrus yields to maintain sub-20% prime beverage costs and healthy blended margins.
Designed For:
What’s Inside the Workbook (Tab-by-Tab Breakdown)
01_Menu_Engineering_Matrix
Executive dashboard featuring 5 top-level KPI cards (Total Sales Revenue, Total Food Cost, Weighted Food Cost %, Total Contribution Margin, and Quadrant Profile), followed by the complete 12-item Kasavana & Smith menu matrix calculating volume mix, popularity hurdles, margin classes, and automated quadrant badge assignments.
02_Recipe_Cost_Cards
Six detailed commercial recipe cost cards (USDA Prime Ribeye, Wild Mushroom Pappardelle, Atlantic Salmon Beurre Blanc, Double Smash Cheeseburger, Wood-Fired Margherita Pizza, and Classic Venetian Tiramisu) showing ingredient line items, AP/EP yields, portion quantities, Q-factor markups, packaging allowances, and suggested menu prices.
03_Ingredient_Master_Library
Master broadline distributor purchasing database containing 40 realistic culinary ingredients across 7 categories (Meats, Poultry, Seafood, Produce, Dairy, Dry Goods, Oils/Spices) with case purchase costs, pack quantities, baseline units, prep yield percentages, true EP costs, and vendor update dates.
04_Yield_Reference_and_Guide
Authoritative USDA and American Culinary Federation (ACF) preparation yield standards, foodservice concept food cost percentage benchmarks (Fine Dining to Craft Bars), prime cost targets, and step-by-step operating procedures for kitchen cost control.
Practitioner Tips & Best Practices
-
✓
Always Conduct Physical Butcher Yield Tests on Center-of-Plate Proteins: Never rely solely on manufacturer spec sheets for expensive primal cuts. Fabricate a 12-lb ribeye or 10-lb salmon side in-house, weigh the usable portions on a calibrated digital scale, and enter your actual kitchen yield percentage into Sheet 03.
-
✓
Never Skip the Q-Factor (Seasoning & Pan Cooking Allowance): Micro-ingredients like kosher salt, peppercorns, sauté butter, and grill searing oil seem trivial on an individual plate, but uncosted seasonings accumulate to 2%–4% of annual food purchases. Always include a standardized 2.5%–4.0% Q-factor on every recipe card.
-
✓
Target Dollar Contribution Margin Rather Than Food Cost % Alone: A high-end 12-oz prime ribeye running at 31% food cost yields $30.32 in gross profit, whereas a plate of pasta at 18% food cost yields $21.15 in gross profit. You pay rent and payroll with dollars, not percentages; balance your menu to maximize total gross margin.
-
✓
Surgically Treat Plowhorses and Puzzles Before Touching Prices: If an item is a Plowhorse (high volume, low margin), do not risk guest blowback with a sudden $3 price hike. First trim 0.5 oz of expensive protein, substitute an upscale garnish, or test a modest $0.50–$0.75 adjustment to see if volume holds.
Frequently Asked Questions
What is the difference between As-Purchased (AP) and Edible Portion (EP) cost in restaurant accounting?
As-Purchased (AP) cost is the raw invoice price paid to the food distributor per case, pound, or unit before any kitchen handling. Edible Portion (EP) cost is the true cost per usable unit after accounting for butcher trimming, bone removal, peeling, and thermal cooking shrinkage. Because trimming reduces usable yield (e.g., an 88% yield on prime ribeye), the true EP cost per pound is always higher than the AP purchase price. Failing to use EP costs leads to systematic under-costing of menu items.
What is a Q-Factor in restaurant recipe costing and how should it be calculated?
A Q-factor (Quantity factor) is a percentage markup added to a recipe's direct ingredient cost to account for unmeasured micro-ingredients that are impractical to weigh for every portion—such as cooking oils, fryer shortening, pan spray, kosher salt, cracked black pepper, butter basting, and fresh herb garnishes. In commercial kitchens, standard Q-factors range between 2.5% and 5.0% of raw food costs.
What is an ideal restaurant food cost percentage benchmark?
While general hospitality guidelines cite an ideal food cost between 28% and 32%, true benchmarks vary substantially by restaurant concept and menu category. Pizzerias and Italian pasta concepts often operate at 16% to 22% food cost, commercial bakeries at 14% to 18%, and craft bars at 12% to 16%. In contrast, high-end steakhouses and seafood bistros frequently run at 30% to 35% food cost because their high dollar check averages generate substantial dollar contribution margins despite higher food cost percentages.
How does the Kasavana & Smith Menu Engineering Matrix categorize dishes?
The Kasavana & Smith matrix benchmarks every dish across two metrics: Sales Volume (Popularity) and Unit Contribution Margin (Profitability). It classifies items into four strategic quadrants: (1) Stars (High Popularity + High Margin), (2) Plowhorses (High Popularity + Low Margin), (3) Puzzles (Low Popularity + High Margin), and (4) Dogs (Low Popularity + Low Margin). This enables operators to make targeted decisions regarding recipe reformulation, merchandising, and pricing.
Can this recipe costing spreadsheet be used in Google Sheets or Apple Numbers?
Yes. This workbook is engineered in standard Microsoft Excel OpenXML (.xlsx) format using universal native formulas (SUM, AVERAGE, ROUND, IFERROR, and logical AND/IF statements). It opens and functions seamlessly in Google Sheets, Microsoft Excel (2016 through Microsoft 365), and Apple Numbers without requiring VBA macros or third-party plugins.
How often should a restaurant update its ingredient prices and recipe cost cards?
Broadline distributor invoice prices in Sheet 03 should be reviewed and updated at least monthly, or weekly for volatile commodities like fresh seafood, poultry, eggs, and dairy. Full recipe cost audits and POS menu engineering matrix analyses in Sheet 01 should be conducted quarterly, or prior to any seasonal menu redesign, to protect operational gross margins against wholesale inflation.